Analysis and Research trends using Word Co-occurrence Network
Co-occurrence networks are basically used to provide and give a graphic visualization of
potential relationships between people, community, organizations, concepts or
other entities represented within the form of written material. The generation
and visualization of co-occurrence networks has become practical with the advent of electronically
stored and save the text amenable to text mining.
By way of definition, co-occurrence
networks are the collective interconnection of terms based on their paired
presence within a specified unit of text. Networks are generated by connecting
pairs of terms using a set of criteria defining co-occurrence. For example,
terms A and B may be said to “co-occur” if they both appear in a particular
article. Another article may contain terms B and C. Linking A to B and B to C
creates a co-occurrence network of these three terms. Rules to define
co-occurrence within a text corpus can be set according to desired criteria. For example, more
stringent criteria for co-occurrence may require a pair of terms to appear in
the same sentence.
Research & Understanding Trends:
1.
Bibliometric cartography
of information:
·
It is important nowadays, for
both intellectual and policy reasons, to be able to map the relationship
between concepts, ideas and problems in science and social sciences. Bibliometric
research is devoted to quantitative studies of literature.
·
Co-word analysis reduces and
projects the data into a specific visual representation with the maintenance of
essential information containing in the data.
·
Co-word analysis, that counts
and analyses the co-occurrences of keywords in the publications on a given
subject, on the other hand, has the potential to address precisely this kind of
analytic problem (Callon, Courtial & Laville, 1991).
2.
Methodology:
·
Co-word analysis draws upon the
assumption that a paper’s keywords constitute an adequate description of its
content or, the links the paper established between problems. Two keywords
co-occurring within the same paper are an indication of a link between the
topics to which they refer (Cambrosio, et. al., 1993).
·
The presence of many
co-occurrences around the same word or pair of words points to a locus of
strategic alliance within papers that may correspond to a research theme.
·
The main feature of co-word
analysis is that it visualizes the intellectual structure of one specific
discipline into maps of the conceptual space of this field.
3.
Data collection:
·
Words are the most important
research elements in co-word analysis. There are two ways to extract words from
journal articles, conference papers, reports or even chapters of books.
·
One of the most significant
reservations about this data collection from controlled vocabulary is the
possibility of an “indexer effect”.
·
Another method of data
collection involves extracting words directly from full-text documents by using
some software, such as NPtools (Voutilainen, 1993).
4.
Network:
·
Keywords co-concurrence network
is composed of three successive stages of data elicitation, data
transformation, and mapping. First, in the data elicitation stage, core
keywords are identified from collected literatures. In the data transformation
stage, co-word matrix is constructed by measuring the co-occurrence frequency
of keywords in the articles.
·
In the keyword network, this
represents the importance of a keyword in bridging subsets of keywords. A
keywords that lies between two distinctive research themes can have high
between’s centrality even though it may have a small number of connections to
other keywords in each theme(Freeman, 1979).
5.
Measurement:
·
We examined the characteristics
of the keyword networks and identified important keywords from the view point
of their frequency of use in the publications and centrality in the keyword
network.
·
In order to understand the
characteristics of the overall keyword network in ET research, we selectively
used between’s centrality measuring. This is the extent to which a node lies on
the paths between other nodes.
·
This method enables the
researchers to explicitly understand representation of emerging themes.
·
In this computer software, Net draw, is used to
visualize network and then network properties are subsequently calculated and
play a important rule.
6.
Result Findings:
·
The basic matrix for the
analysis represents the occurrences of words in documents. Documents are
considered as the units of analysis.
·
The asymmetrical word–document
matrix called a 2-mode matrix. An affiliation network can also be represented
as a bipartite graph. In a bipartite graph nodes can be partitioned into two
subsets and all lines are between nodes from different subsets.
·
In the bipartite graph for an
affiliation network, the lines indicate ties of affiliation.
7.
Keywords co-concurrence
network:
·
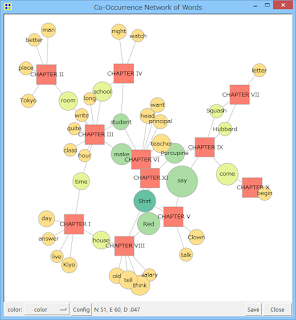
The links between nodes are
symmetric and a link between two keywords is numbered in keyword network. Also this
shows how many times the two keywords appear in the network, this number shows
the strength of the connection.
·
The size of the node provides a
relative indication of the number of times each keyword was mentioned.
·
The width of the links
represents the number of times each pair of keywords were mentioned together in
paper.
·
Isolates have been removed from
the network to aid interpretation.


Comments
Post a Comment